e-mail: dvkazakov @ gmail.com
(remove spaces on both sides of @)
 Phone/WhatsApp: +7-916-909-7864
 Telegram: @denis_v_kazakov

 Skype: denis.v.kazakov
![]()
|
|
e-mail: dvkazakov @ gmail.com |
|
|
|
|
|
|
Study project
Content:
|
|
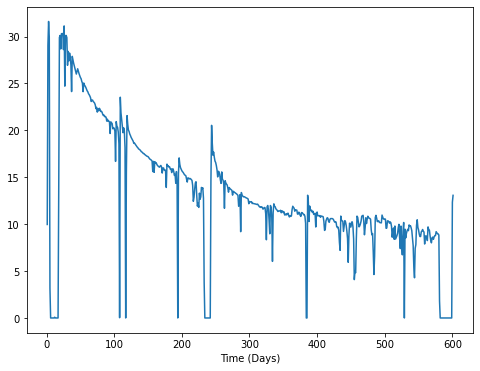
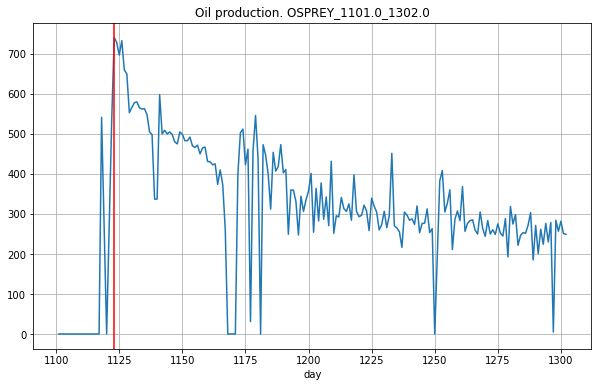
Flow rate of wells producing shale oil and gas usually declines with time. It is important to predict the decline rate and total volume to be produced (estimated ultimate recovery) to forecast the project performance.
The dataset includes data on 53 wells, of which 11 are wells and the rest produced only gas. All wells also produced some water. The data are complex, with major changes (recompletion, treatment) made to many wells several times during their life and shutdown periods with no production. Early production is unstable with erratic changes in flow rate. (Red vertical lines below indicate dates of changes.)
The dataset also includes data on geology and well design.
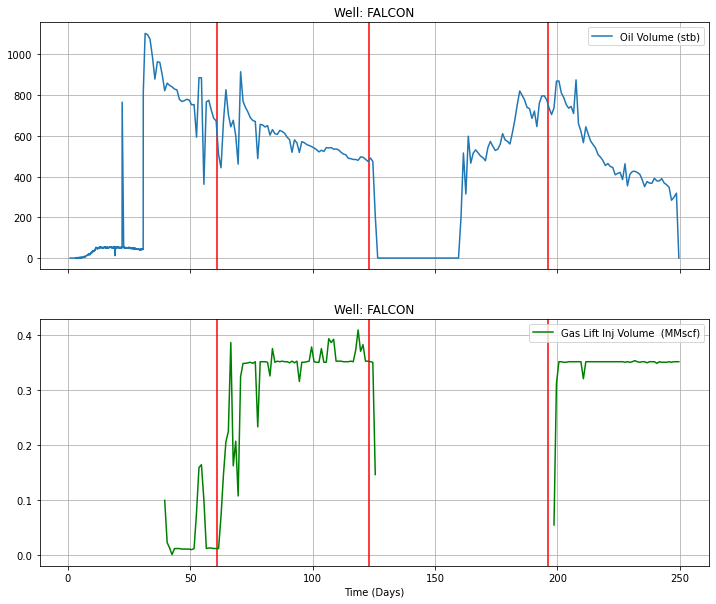
Gaslift was used in all oil wells at some periods, but not always.
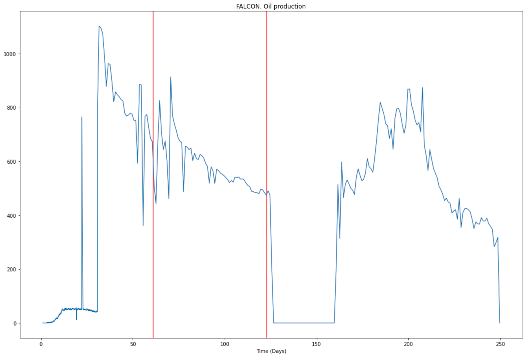
Data preparation
I identified all points of change, separated oil production from gas production and removed periods with unstable production. Data were split into periods with relatively stable production modes. Variables were converted to enable the use of linear regression (as one of possible options). The vertical line below separates a period of unstable production.
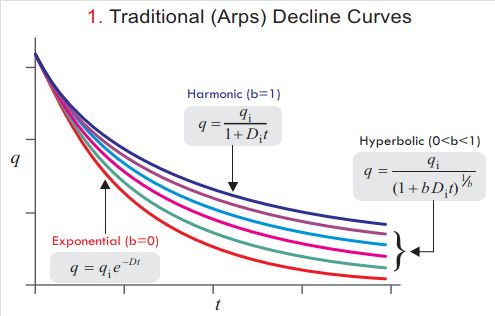
It was really a separate project it its own right. Production decline from unconventional reservoirs is often described with Aprs curves, with three versions: exponential, harmonic and hyperbolic. The project purpose was to find out whether Arps decline curves could be used in this case.
I tried several approaches:
Two approaches for the exponential curve: transformation of variables to use linear regression and direct curve fitting using the SciPy package. Only SciPy curve fitting was used for the other two types of curves.
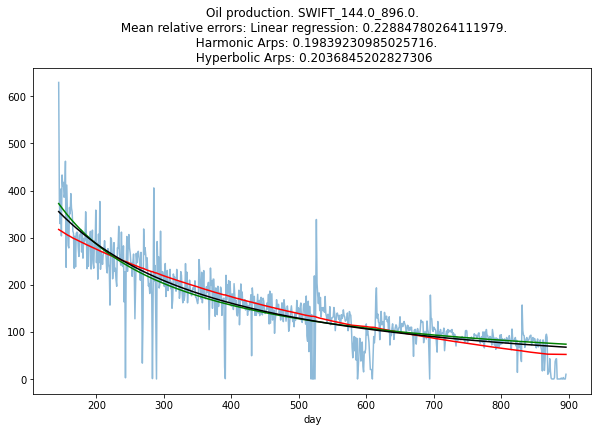
As all time intervals and production volumes were different, I used mean absolute percentage error (MAPE) (scikit-learn).
The approaches produced similar results, although errors of linear regression and exponential curves were very high in some cases. The hyperbolic and harmonic curves worked well, given a very simple model and limited dataset.
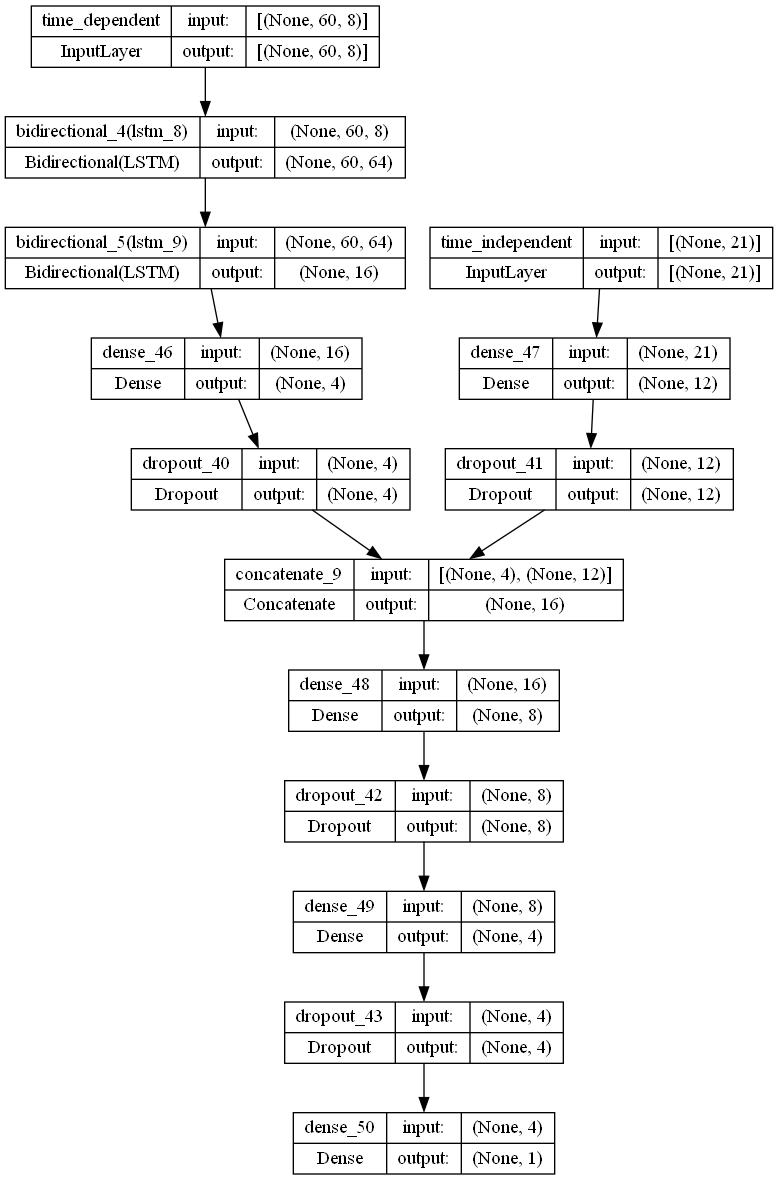
The model input data have different dimensions: data on wells and geology are one-dimensional, while oil, gas and water production data are two-dimensional as I used initial production period to train the model so the data depend on time.
I tried several neural network architectures with and withouth LSTM. Oil well sample was very small, only 22 curves, so I used one well as the test set. Neural network training results were unstable (repeated training would produce different results), the model tends to overfit. MAPE on the test well was about 60%.
Gas well sample was larger: 53 curves (50 in the train set and 3 in the test set). I added regularization (dropout). Results improved. When the length of the initial production period used to train the model is 60 days, MAPE on the test set is 20 to 25%, although there are still some issues with instability and overfitting.
The next step would be to combine the neural network training with curve fitting as Aprs curves provide a good description of production decline or to find a larger dataset.
An example of neural network architecture: